Artful displays track data
By
Chhavi Sachdev ,
Technology Research NewsTaking a break from work to check email, a stock quote or airport delays may be easy as pie, but making these Internet rounds on a busy day can be an annoyance.
Many research projects are dedicated to making this information easy to monitor with a minimum of clicking. Researchers at the Georgia Institute of Technology have written software that also aims to make the experience aesthetically pleasing.
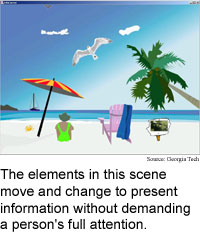
The InfoCanvas system displays an electronic painting that contains movable elements that represent categories of information. The elements shift as information changes. There are a variety of scenes -- a desert, window view, aquarium, beach, and mountain camp. It's "a nice way of persistently communicating information in a consolidated manner, one that is even a little fun," said John Stasko, an associate professor of computing at the Georgia Institute of Technology. The software, written in Java, runs on a PC with an always-on Internet connection.
The dedicated information screen in Stasko's office displays a beach theme. A sailboat moves from left to right between 9 a.m. and 6 p.m. to keep time. The type of clouds in the sky reflect the weather in Pennsylvania where his parents live. A large seagull shows the Dow Jones performance: minus 200 points is the left edge of the screen and plus 200 is the right. Mousing over elements in the image makes small text balloons pop up to display, for instance, "42 degrees." When Stasko gets email from his wife, a towel appears on the beach chair.
The software can handle 15 to 20 pieces of information, said Stasko. The researchers' current prototypes top out at 10 pieces of information.
The software is meant to run continuously on a dedicated display so people can check information simply by glancing at the picture. "We're exploring ways of helping people stay aware of secondary information in a peripheral manner, one that does not distract, interrupt, or annoy them," said Stasko.
And because the display uses abstract elements that can be customized, it allows people to monitor sensitive information, like bank balances, without revealing the information to everyone who enters the office.
Graphical elements can be made to appear or disappear, change form, move along a path, scale up or down, rotate, or populate an area according to changes in the associated data. News headlines and images can appear in the context of the scene, on a billboard or towed by an airplane, for example.
The software is valuable because it provides useful information in a way that does not demand immediate attention, said Scott Hudson, an associate professor of computer science at Carnegie Mellon University. In a world of ubiquitous computing, where each person has several electronic devices, we can't continue to design systems so that they are only useful when they are the center of our attention, he said.
If information displays spread into places like living rooms, they will have to go with the other things there in terms of aesthetics, said Hudson.
To produce the prototypes, the researchers interviewed potential users and had them position paper cut-outs of images on a canvas and describe how they would like the cutouts to represent data, said Todd Miller, a Georgia Tech researcher.
The researchers are currently working on interactive software that will allow users to customize their own pictorial displays, Miller said.
Making sure there is an easy way for users to personalize the displays is important, said Hudson. Given how many households have flashing 12's on their VCRs it should be clear that most end-user's don't have the patience for anything that looks remotely like programming, he noted.
The researchers are also working on adding voice and touch screen capabilities to the pictures, Stasko said.
Stasko and Miller's research colleagues were Shannon Bauman, Julie Isaacs, Jehan Moghazy, Chris Plaue and Zack Pousman. They presented the research at the Computer-Human Interaction (CHI) 2003 meeting in Fort Lauderdale, Florida, on April 7, 2003. The research was funded by the National Science Foundation (NSF).
Timeline: now
Funding: University
TRN Categories: Human-Computer Interaction; Graphics
Story Type: News
Related Elements: Technical paper, "InfoCanvas: A Highly Personalized, Elegant Awareness Display" at Computer-Human Interaction (CHI) 2003 Conference, April, 2003; Shareware customized for the Atlanta region is available for download at http://www.cc.gatech.edu/gvu/ii/infoart/downloads.html
Advertisements:
June 4/11, 2003
Page One
Shock waves tune light
Artful displays track data
Plastic transistors go vertical
Artificial beings evolve realistically
News briefs:
Microfluidics go nonlinear
Browser boosts brain interface
Semiconductor emits telecom light
3D display widens view
Study shows DNA will fill tubes
DNA part makes transistor
News:
Research News Roundup
Research Watch blog
Features:
View from the High Ground Q&A
How It Works
RSS Feeds:
News
Ad links:
Buy an ad link
| Advertisements:
|
 |
Ad links: Clear History
Buy an ad link
|
TRN
Newswire and Headline Feeds for Web sites
|
© Copyright Technology Research News, LLC 2000-2006. All rights reserved.